Die folgenden Projekte entstanden im Kurs "Data Visualization and Management" an der Hochschule München. Der Kurs wurde vom Cal Poly Professor Malcolm Keif unterrichtet.
The following projects were created in the Data Visualization and Management Course at Hochschule München. The course was teached by Malcolm Keif, a Cal Poly Professor.
Cleaning Data
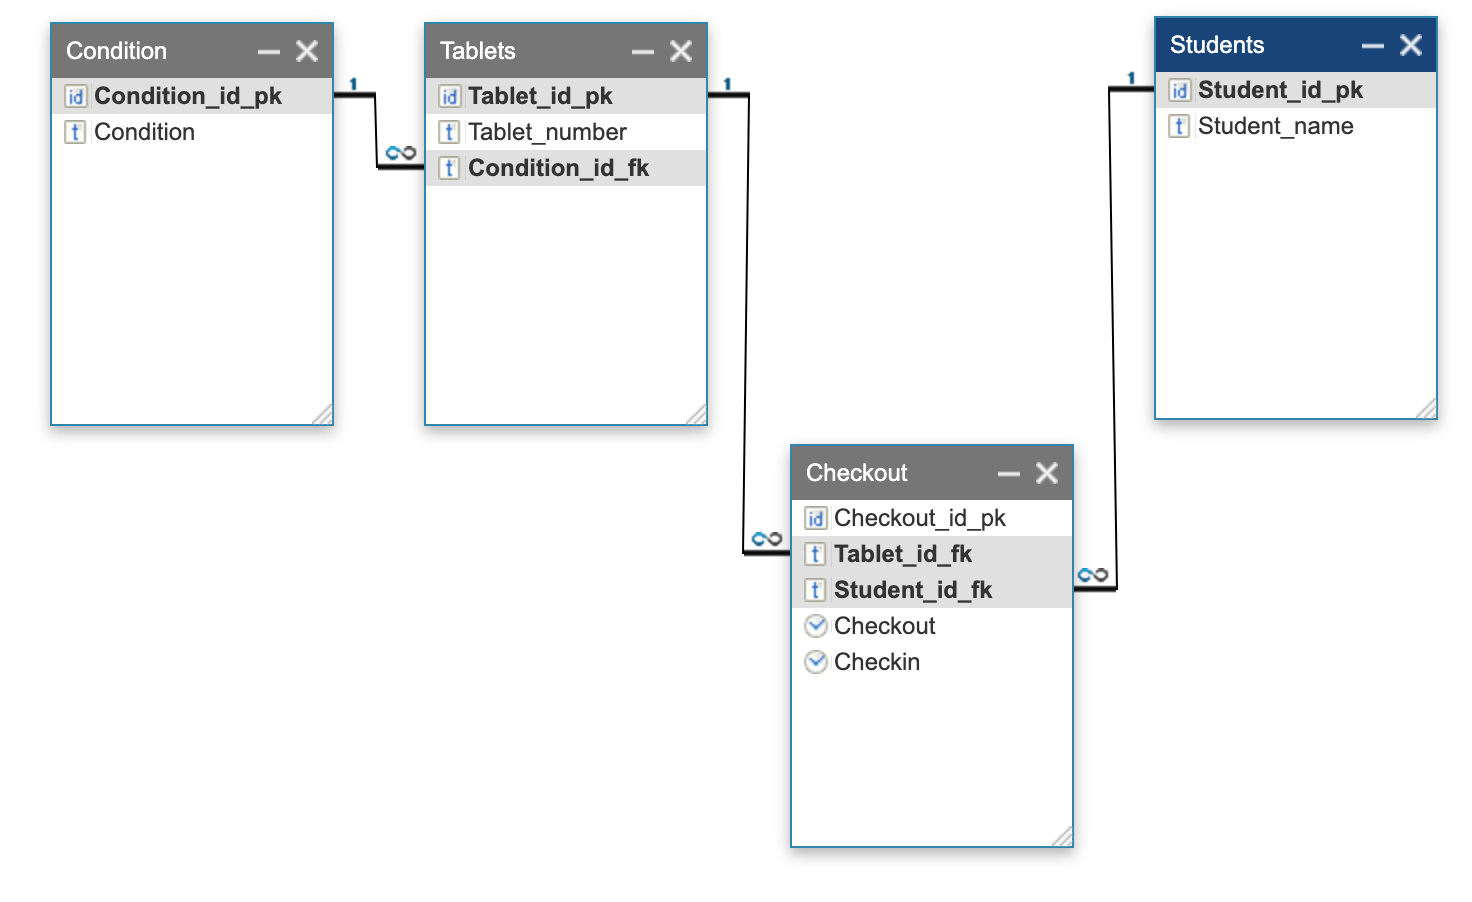
Entity Relationships
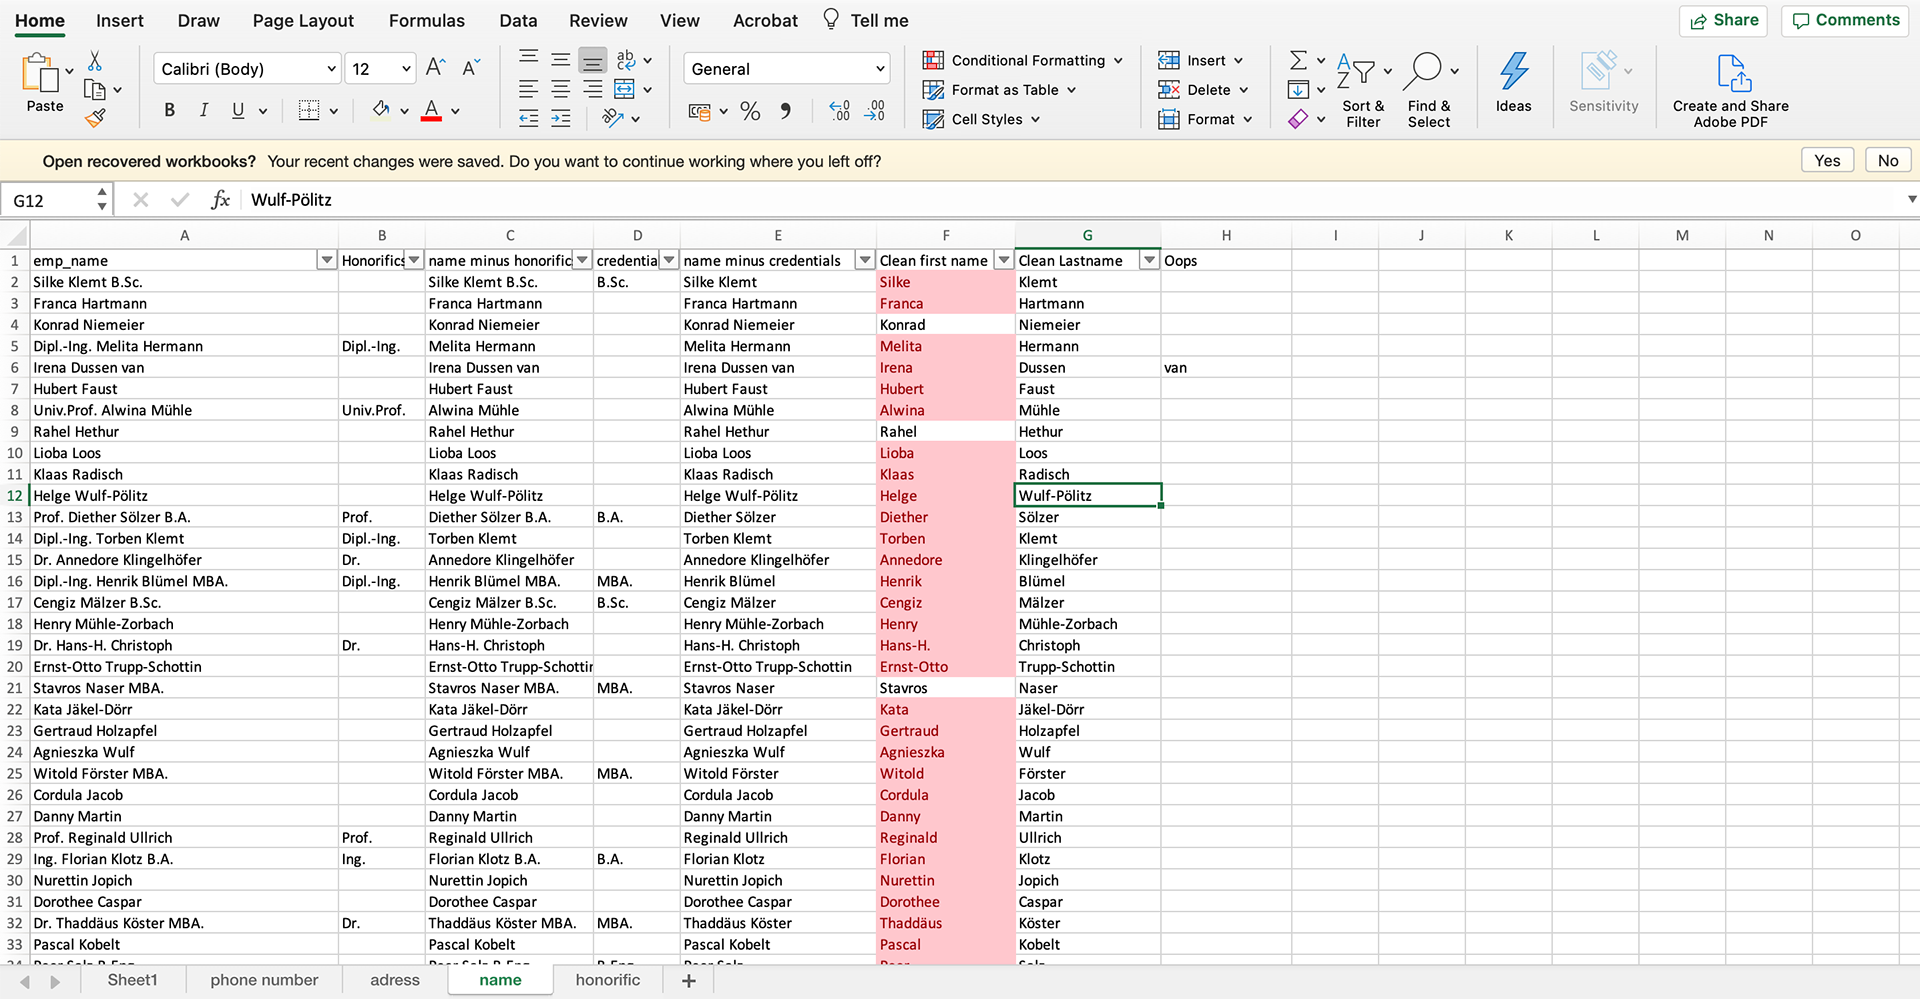
This Excel Sheet shows persons data, like address, phone number and honorifics. The task was to clean that data.
- Conditional Formating
- Text to Columns
- Calculation with If-Conditions
This exercise was about creating tables and relationships among those tables.
- How Database Designs are built
- Forms of Data relationships (one-to-one, one-to-many, ...)
- Datatypes (keys, strings, numbers)
Contextual Menus
Pivot Tables
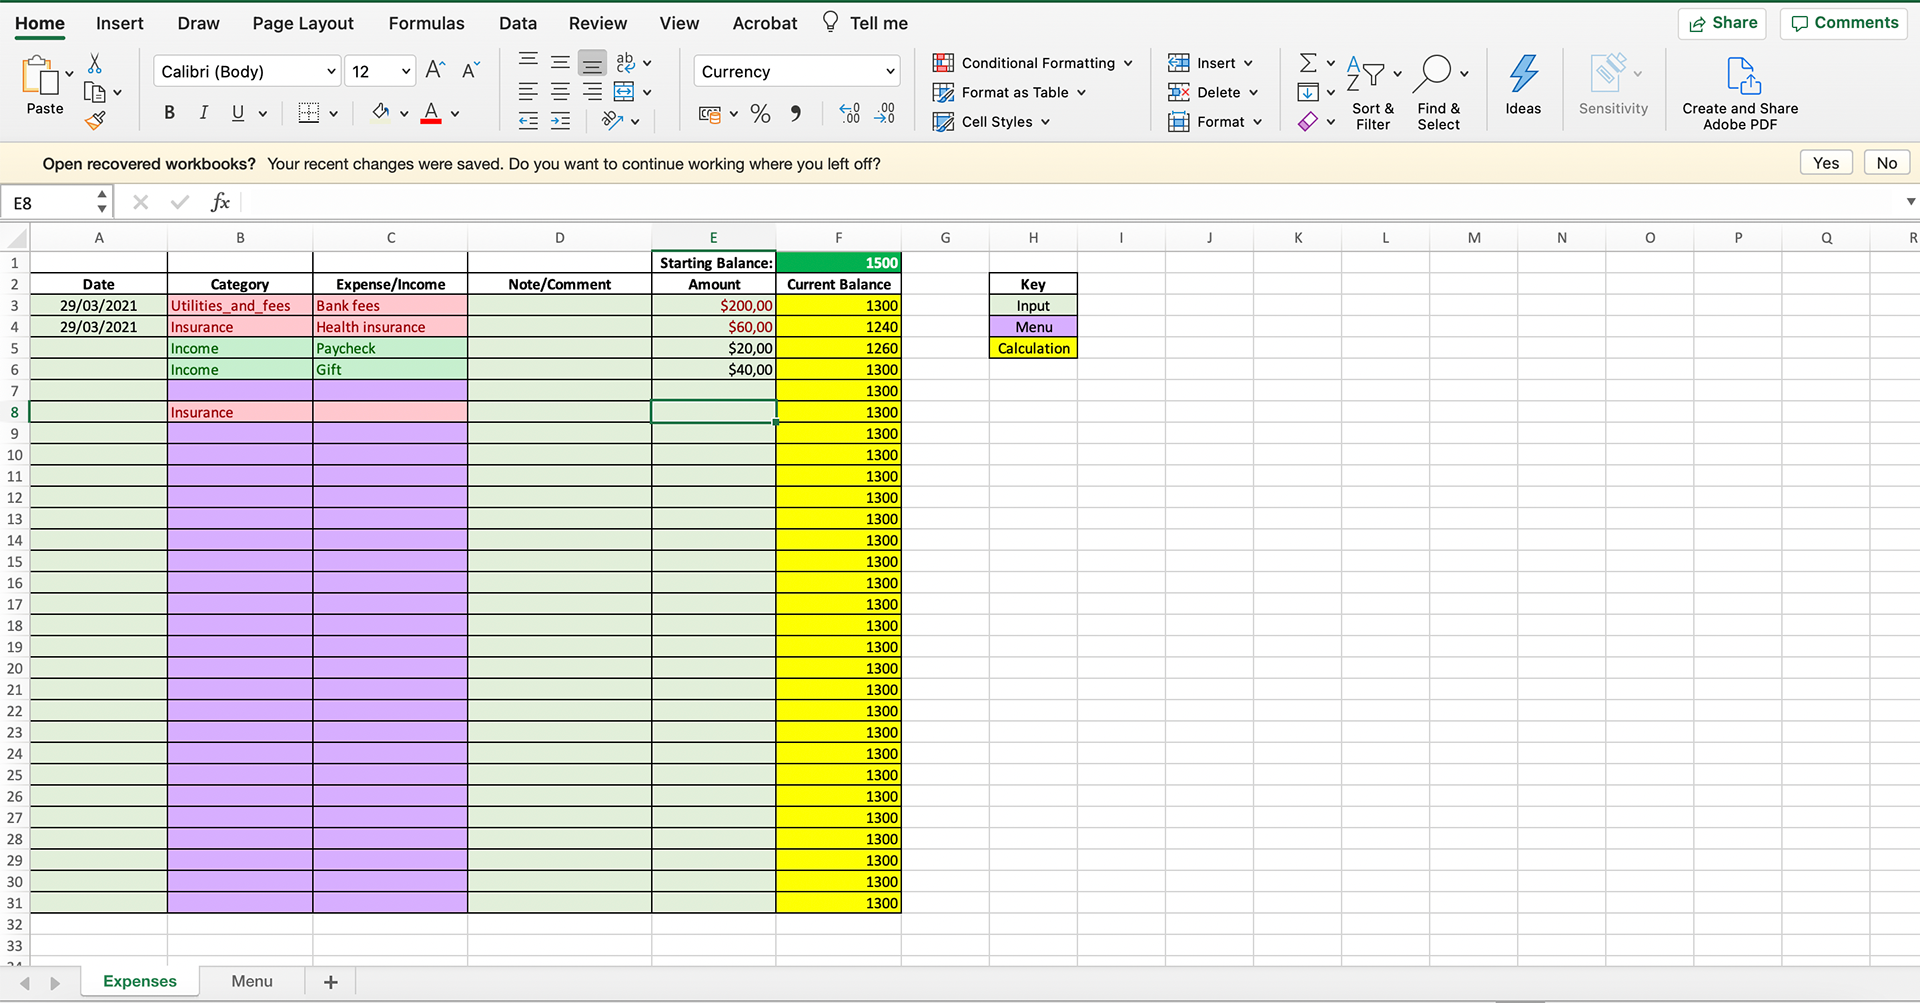
This Excell Sheet shows different menus depending on the menu points that were chosen in another cell.
- Applying names to multiple cells and using them as menus
- Creating menus which are showing up in different context
- Conditional formats that use Formula for Error Handling
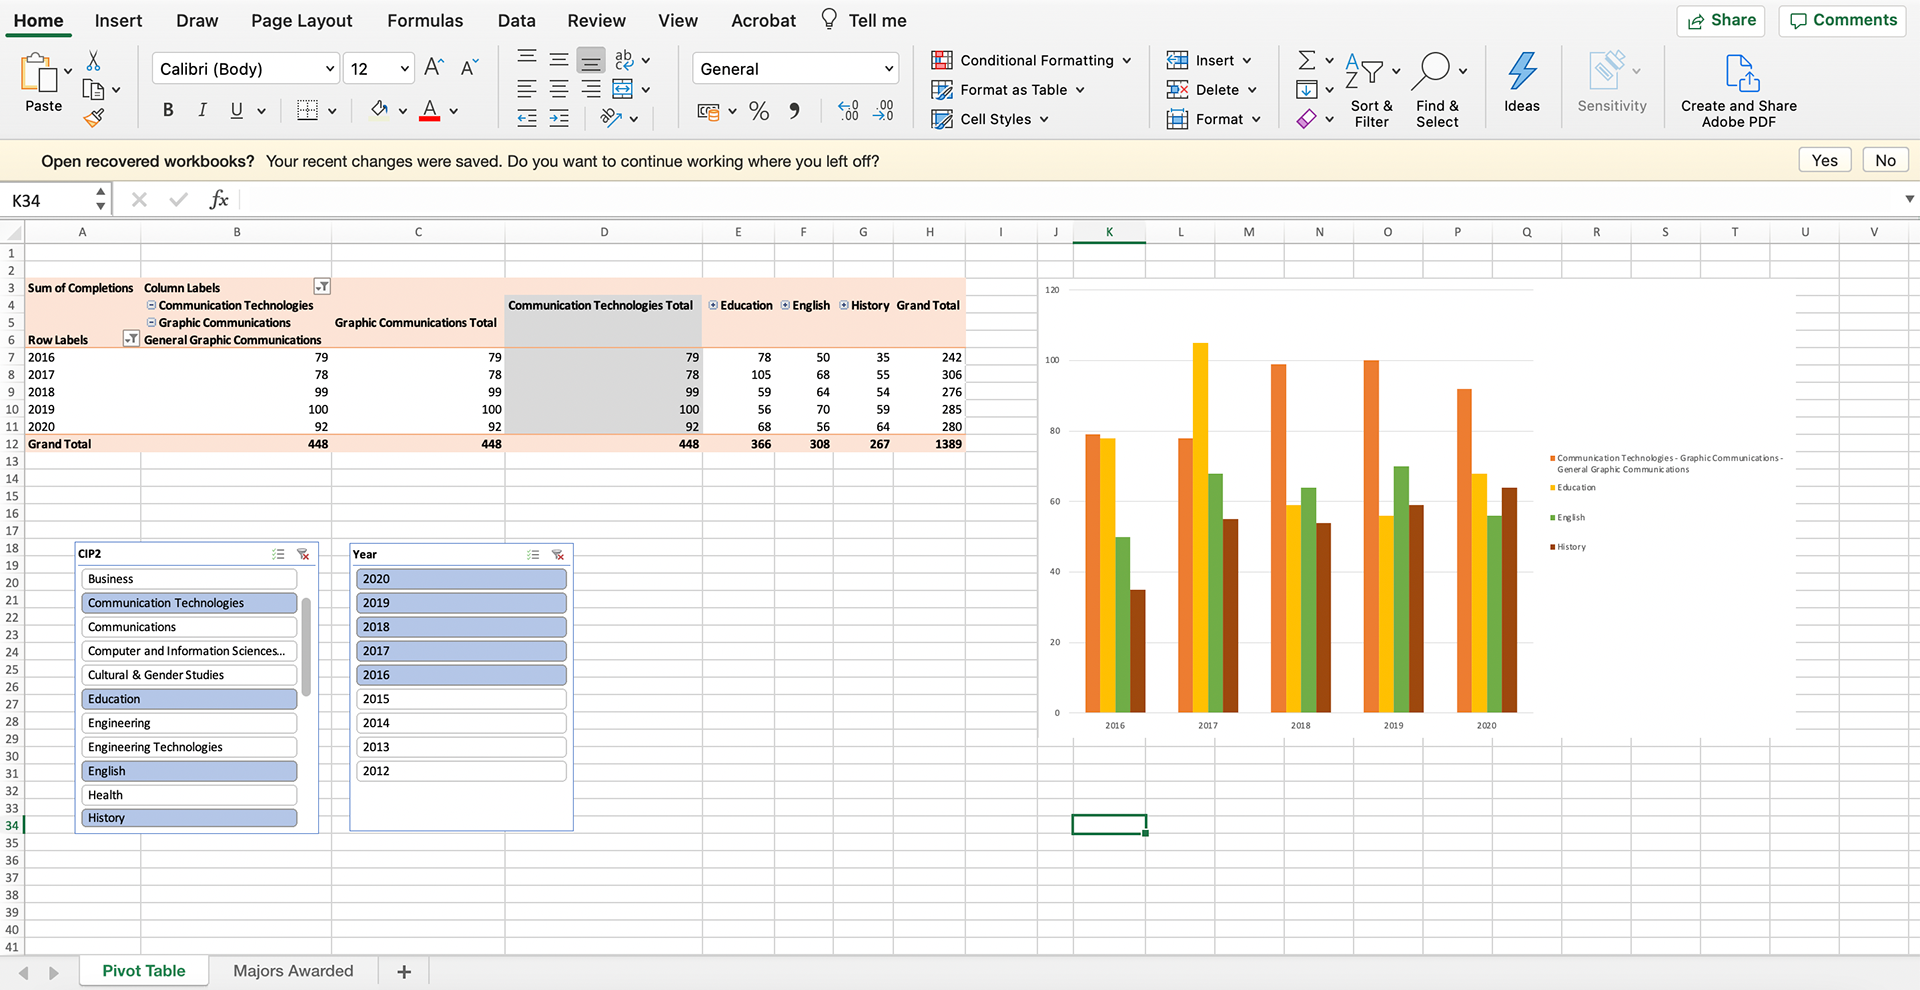
In this Excell sheet a graph was created using Pivot tables.
- Adding a slicer to a Excel Sheet
- Creating individual Charts using pivot tables
VLookups and HLookups
Google Analytics
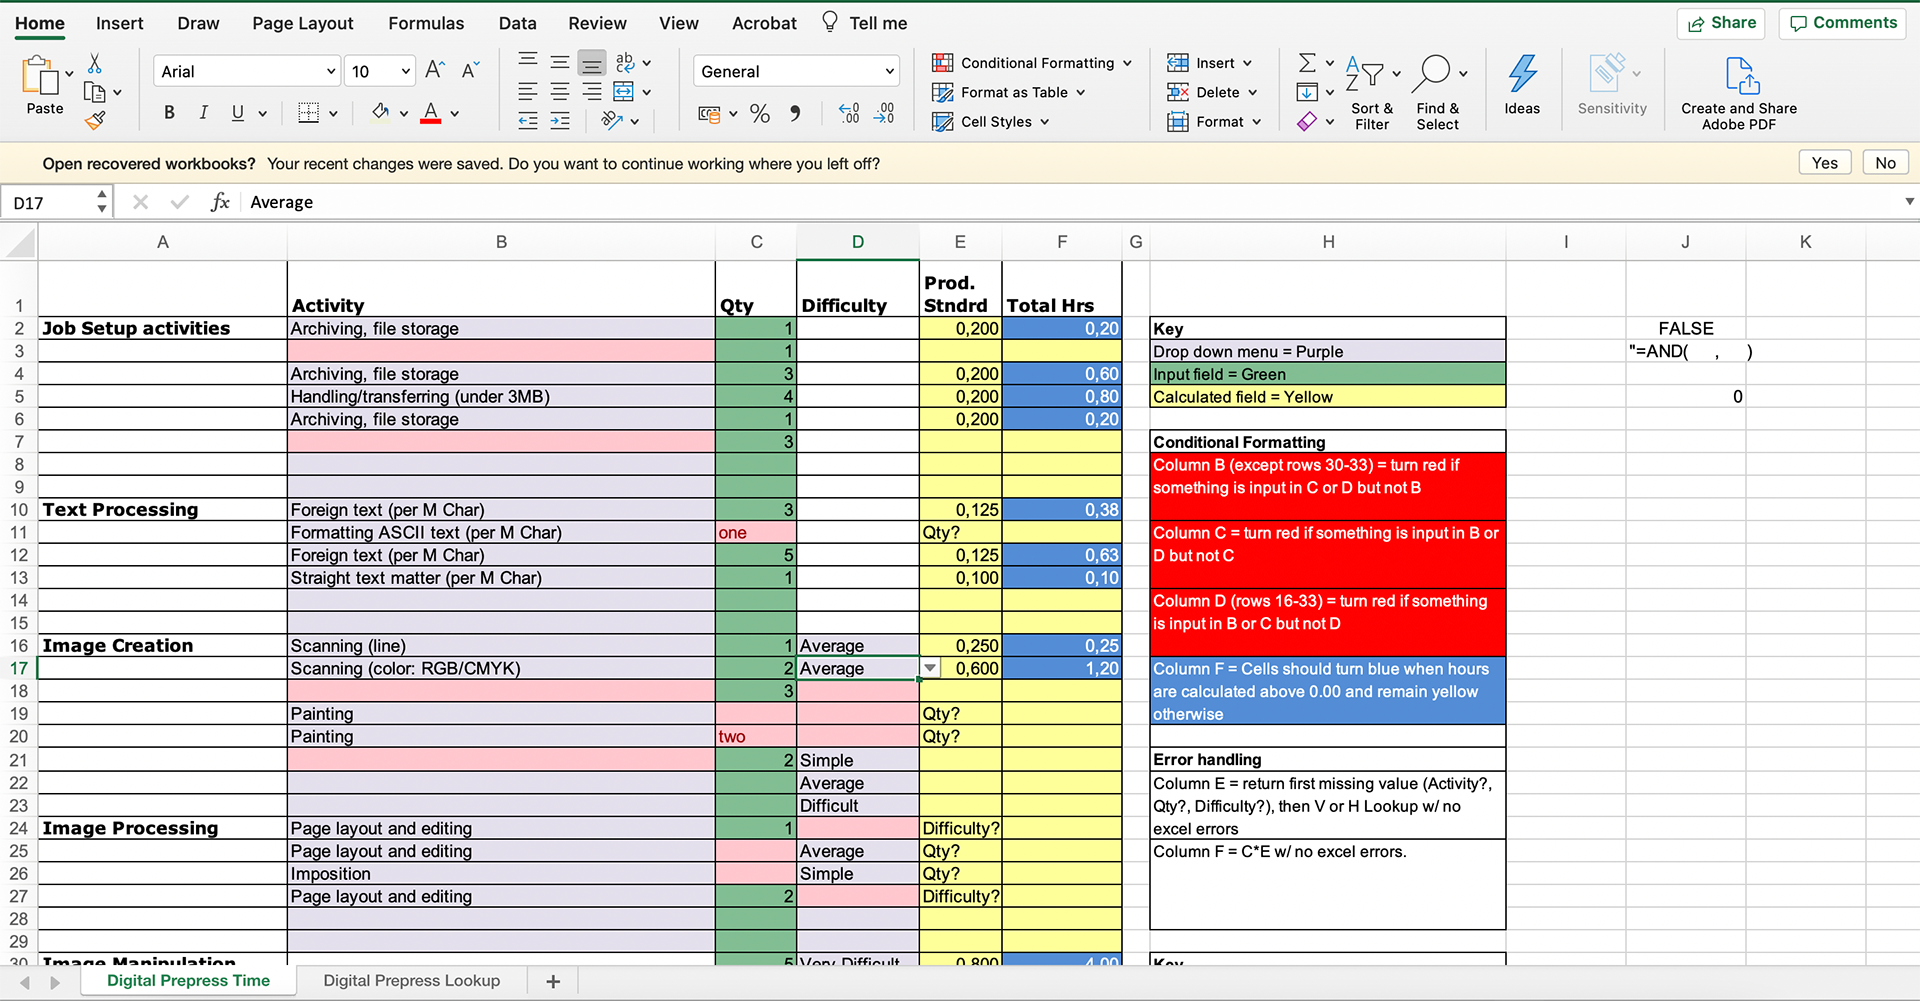
For this project VLookups and HLookups were used to create a calculation sheet for creating a book.
- Adding Formulas with Error Handling (Colors + Text)
- Using VLookups and HLookups for calculations in between different tables
- Creating dropdown menus
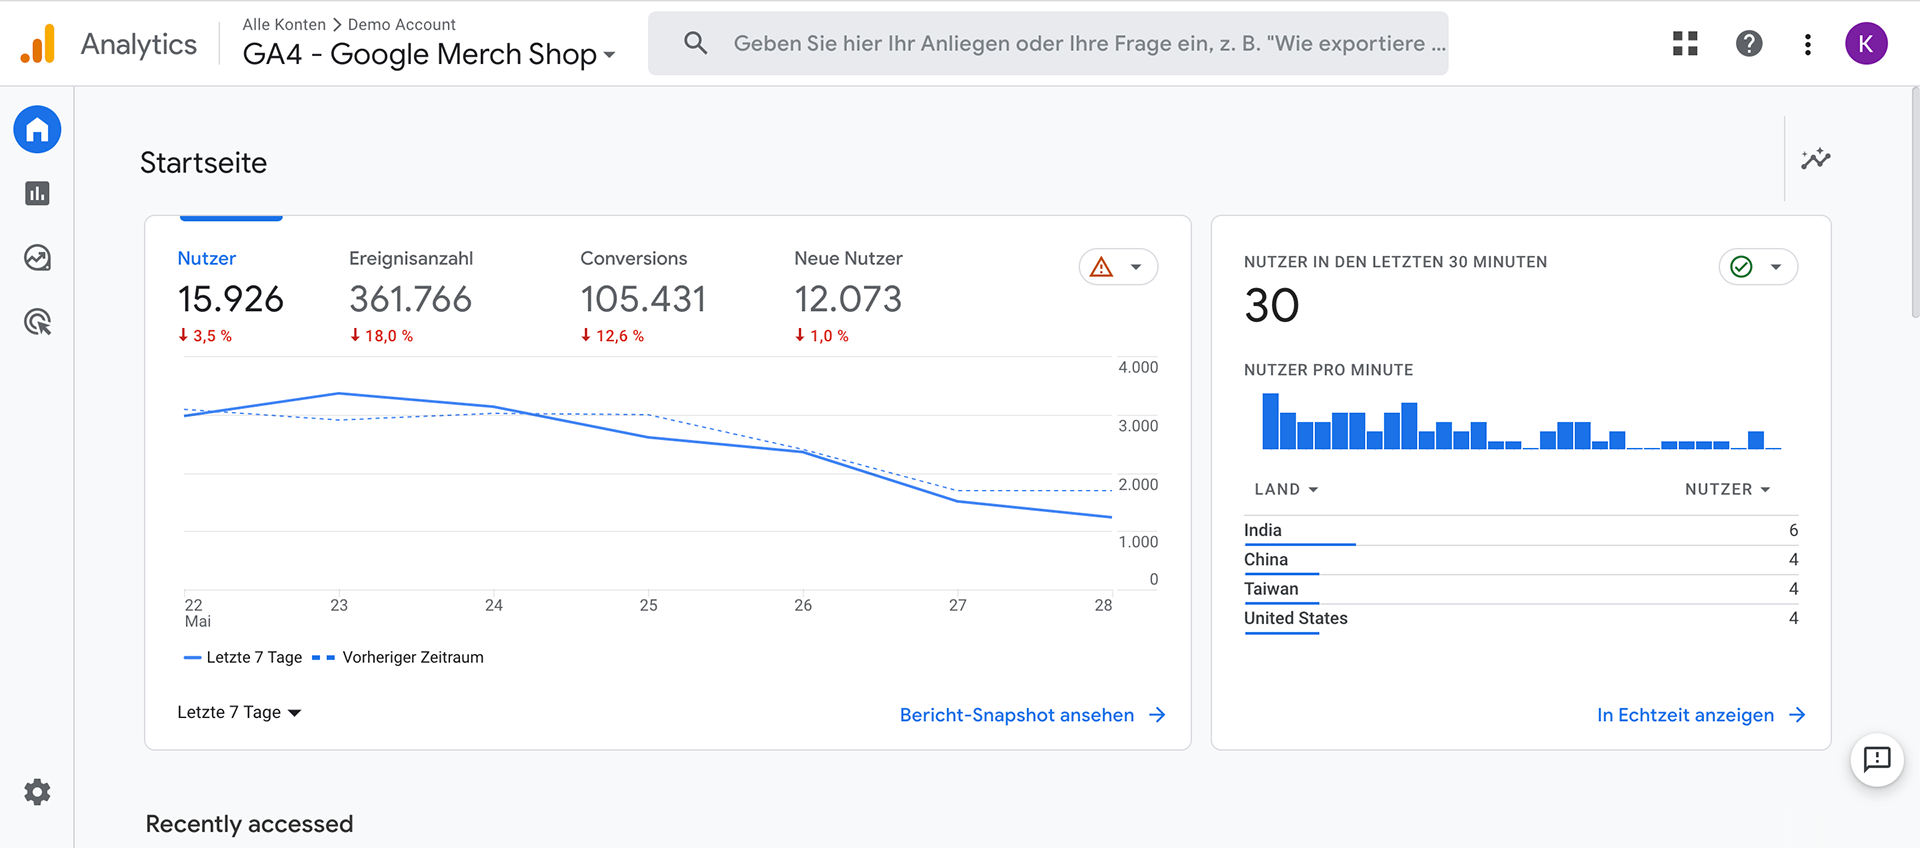
In this exercise Google Analytics was explored.
- Learning how to use GA 4 and UA with Data from Google Merch Shop
- Comparing Data from different time spands
- Understanding numbers used in marketing like CTR, CPC and ROAS
Calculating Digital Media Metrics
Tableau Project 1 - World Indicators
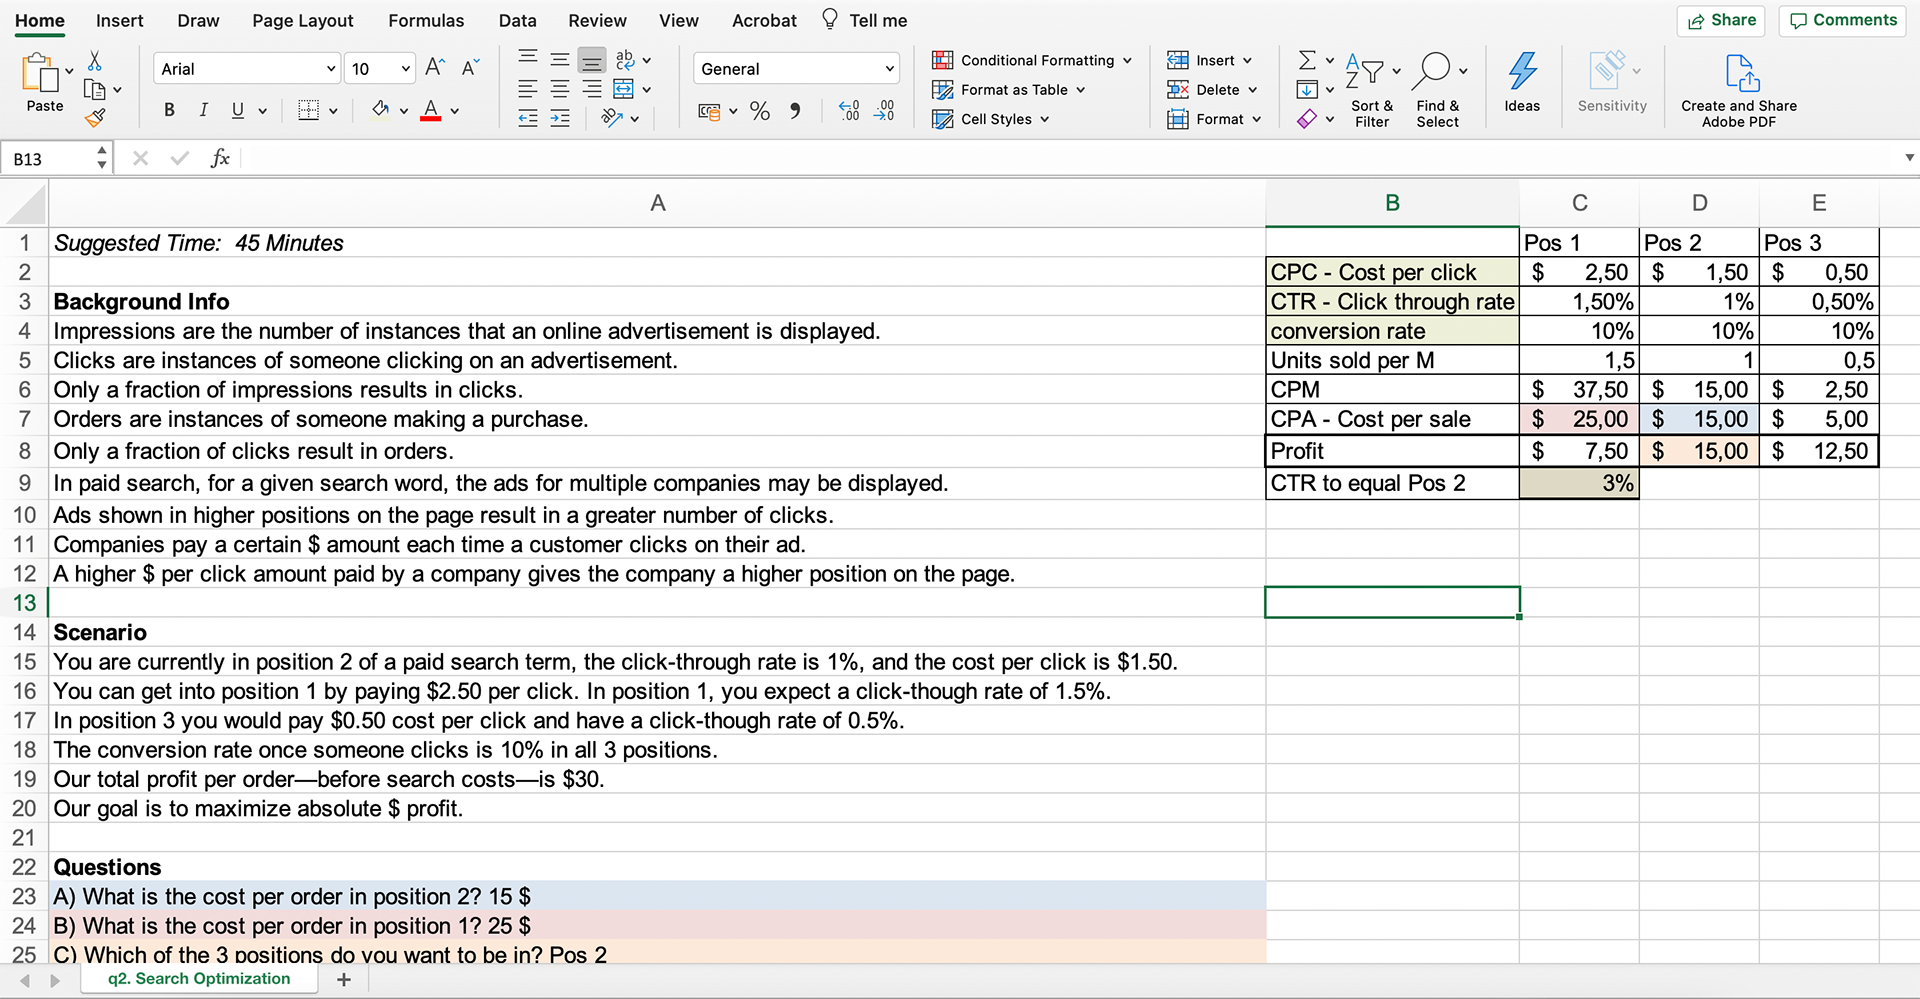
These questions were part of a marketing job interview.
- Calculating the most cost efficient Google Ad Spend
- Understanding CPC, CTR, conversion rate, CPM and CPA
- Learning what is to expected from people working in marketing
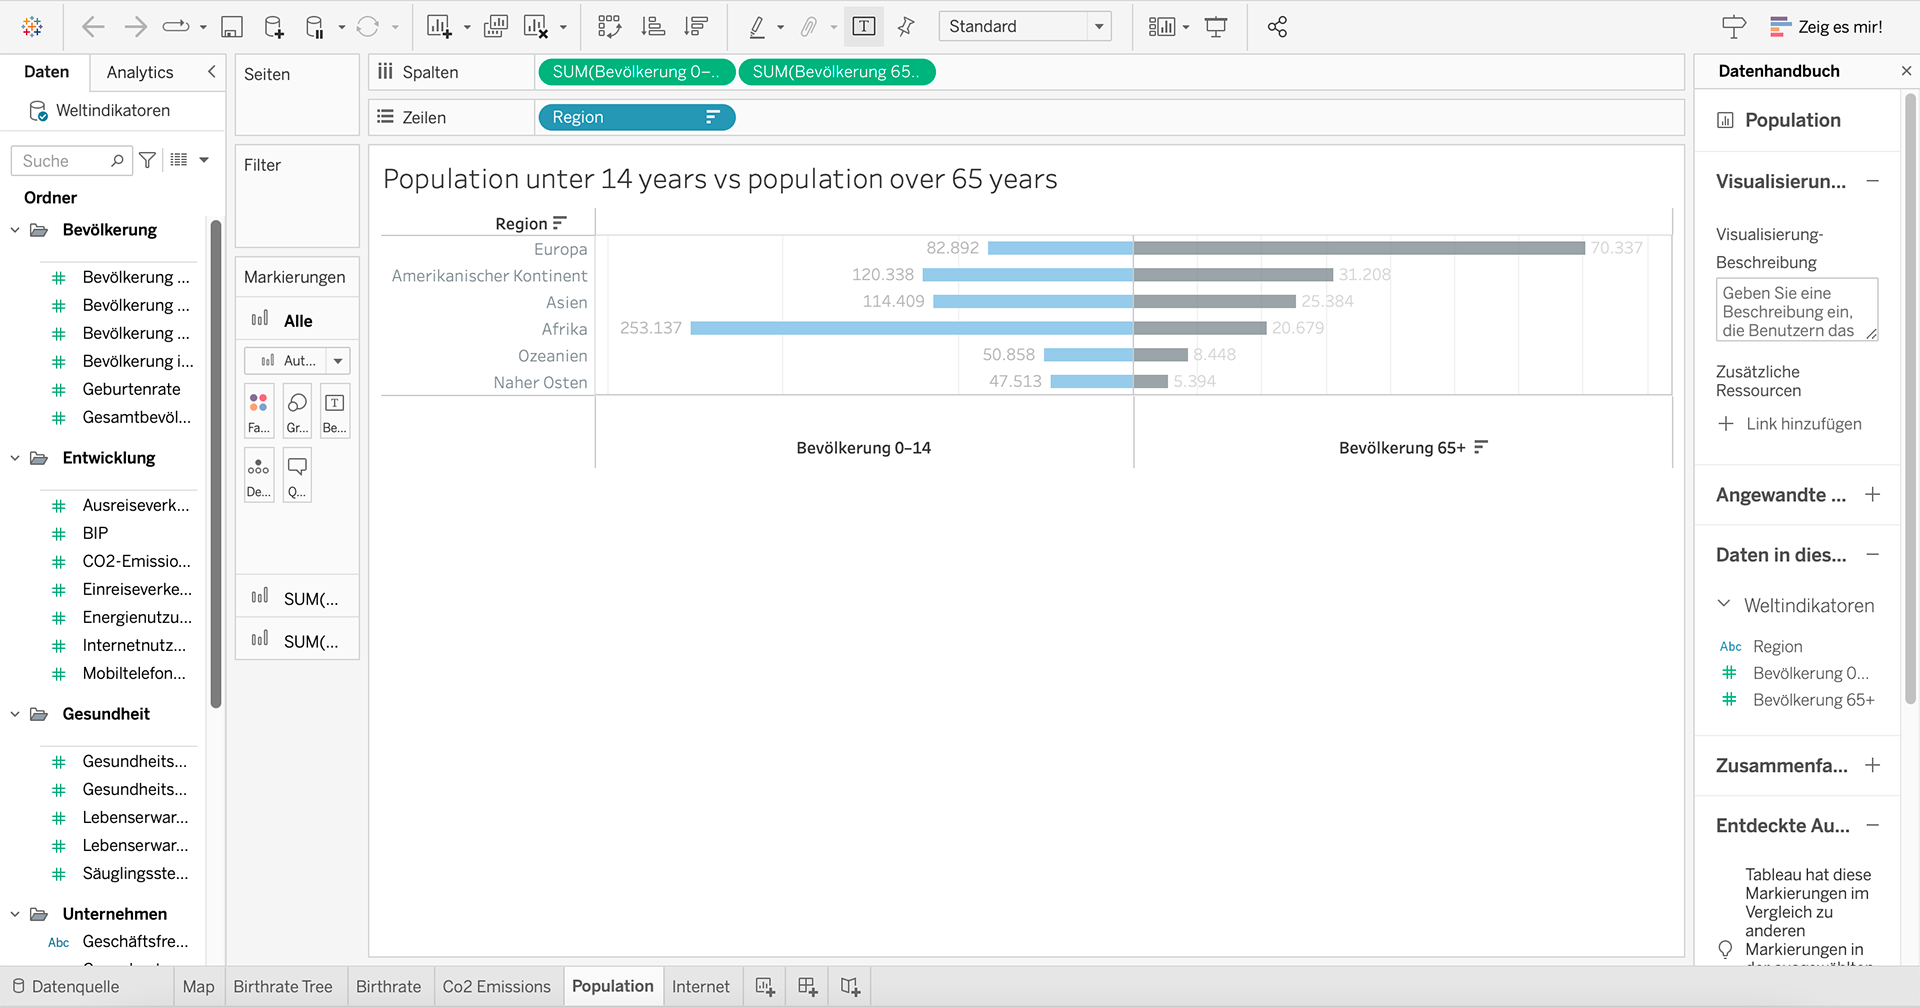
The first Tableau Project: to build basic knowledge about Tableau.
- Using the Tableau World Indicators as data to create first charts in Tableau
- Creating different charts like line and circle diagramms
- Creating a data map using latitude and longitude
Tableau Project 2 - Student Survey
Tableau Project 3 - Munich AirBnB
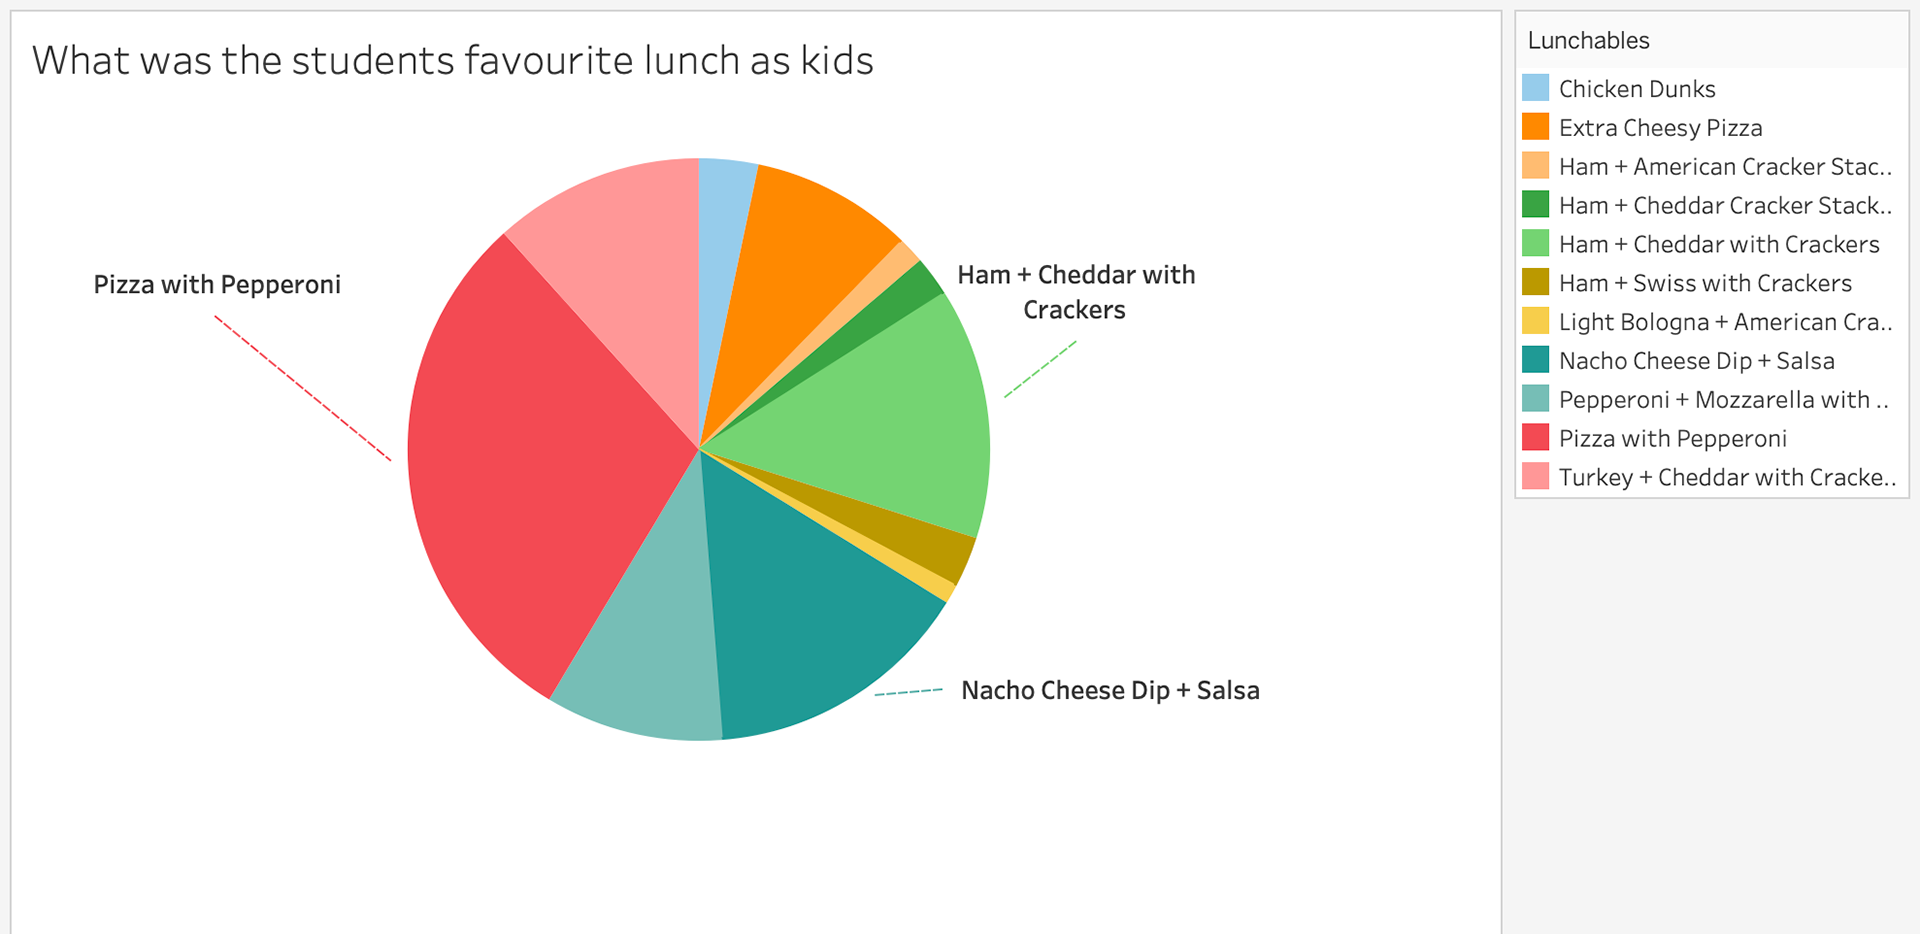
Students were asked about their preferences. This data was used to build different graphs.
- Using Filters in Tableau
- Creating Dashboards in Tableau
- Calculating in Tableau by using the average and median of datasets
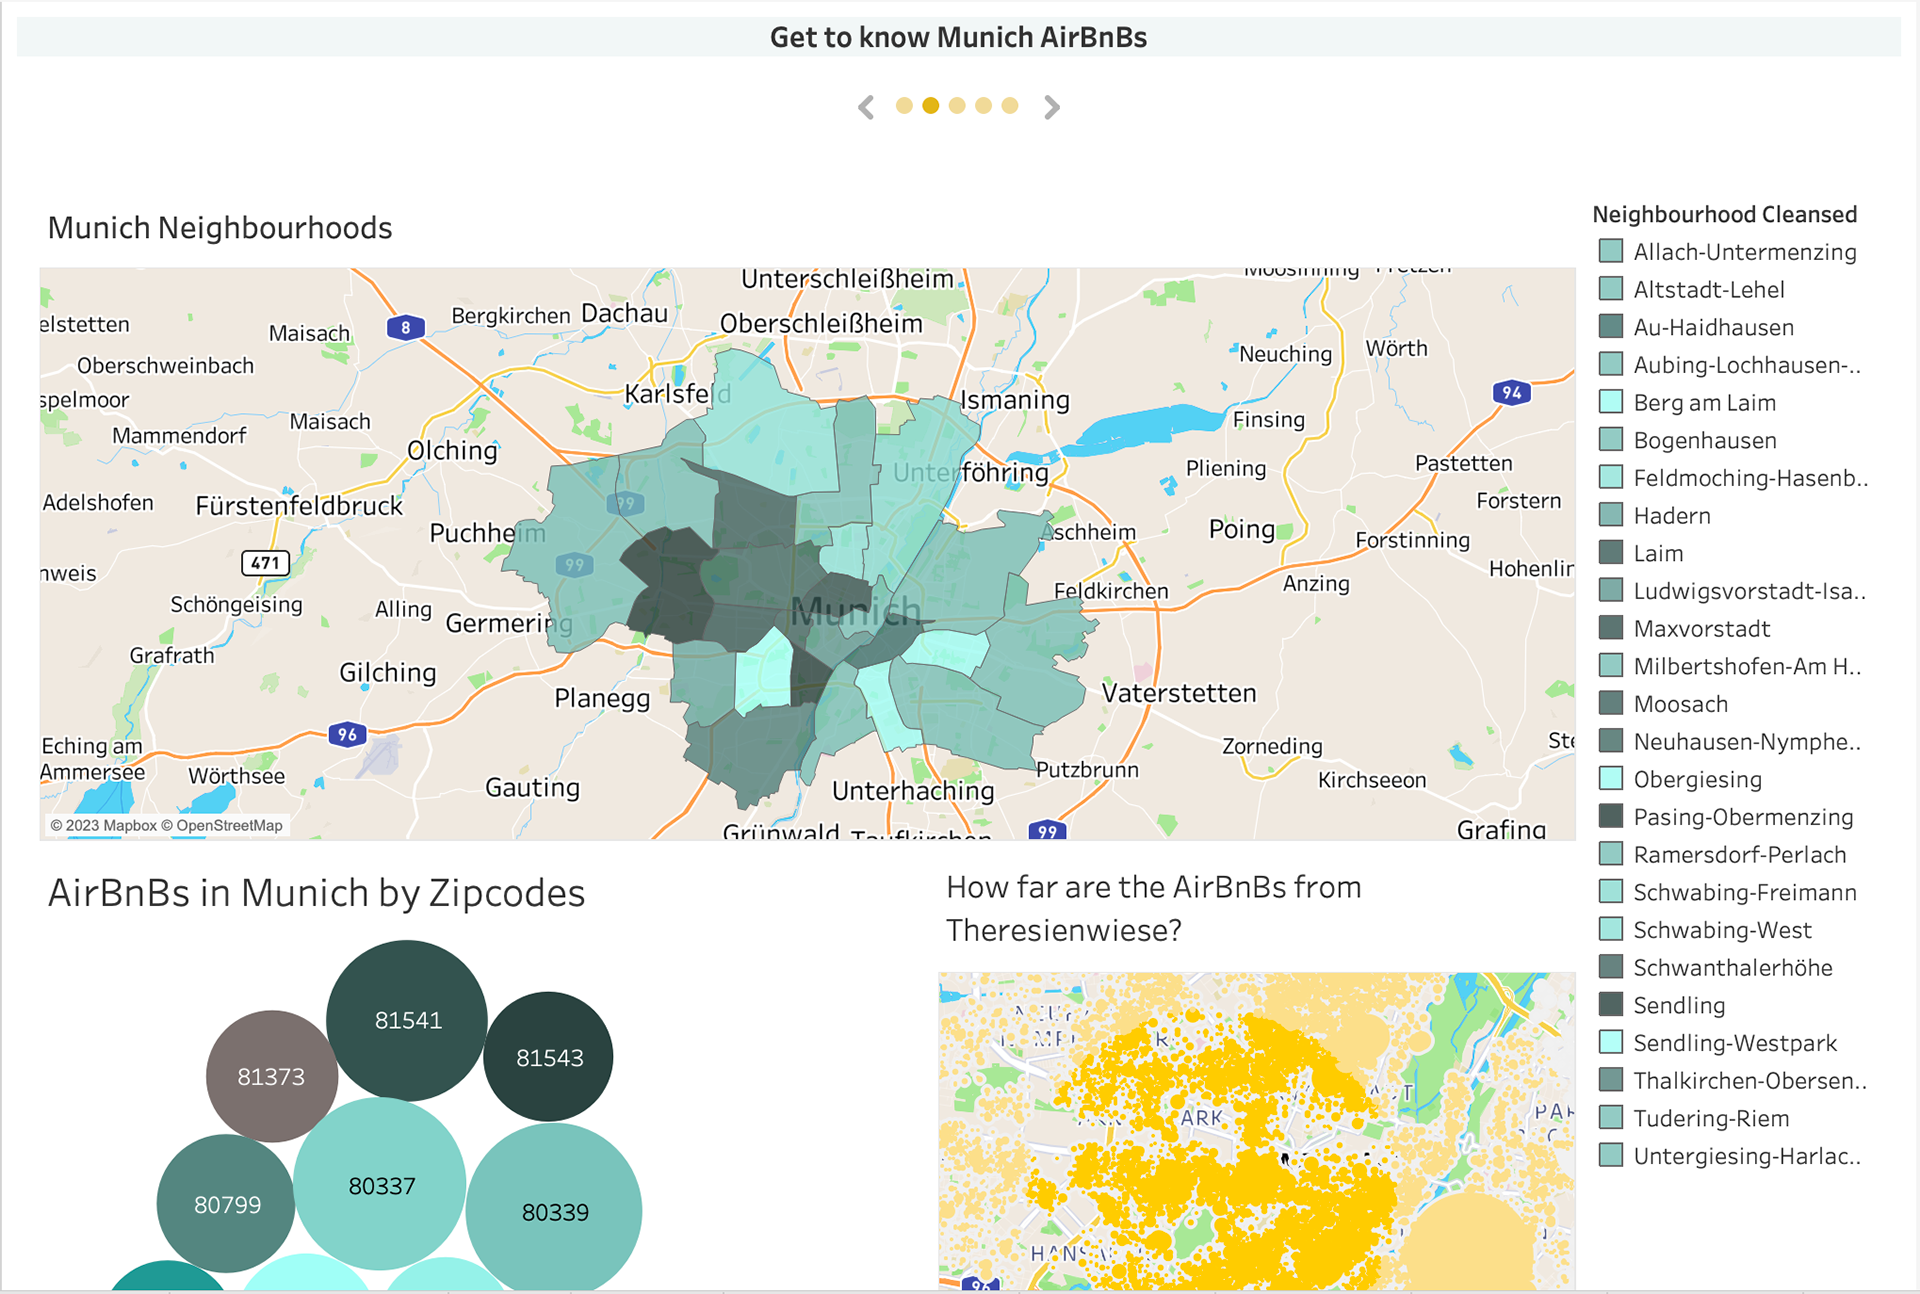
Using data about Munich AirBnBs for creating a Tableau Story.
- Creating a Tableau Story
- Using Location Filters by adding a .json file to the dataset
- Working on the look of the charts by using coordinated colors
Final project

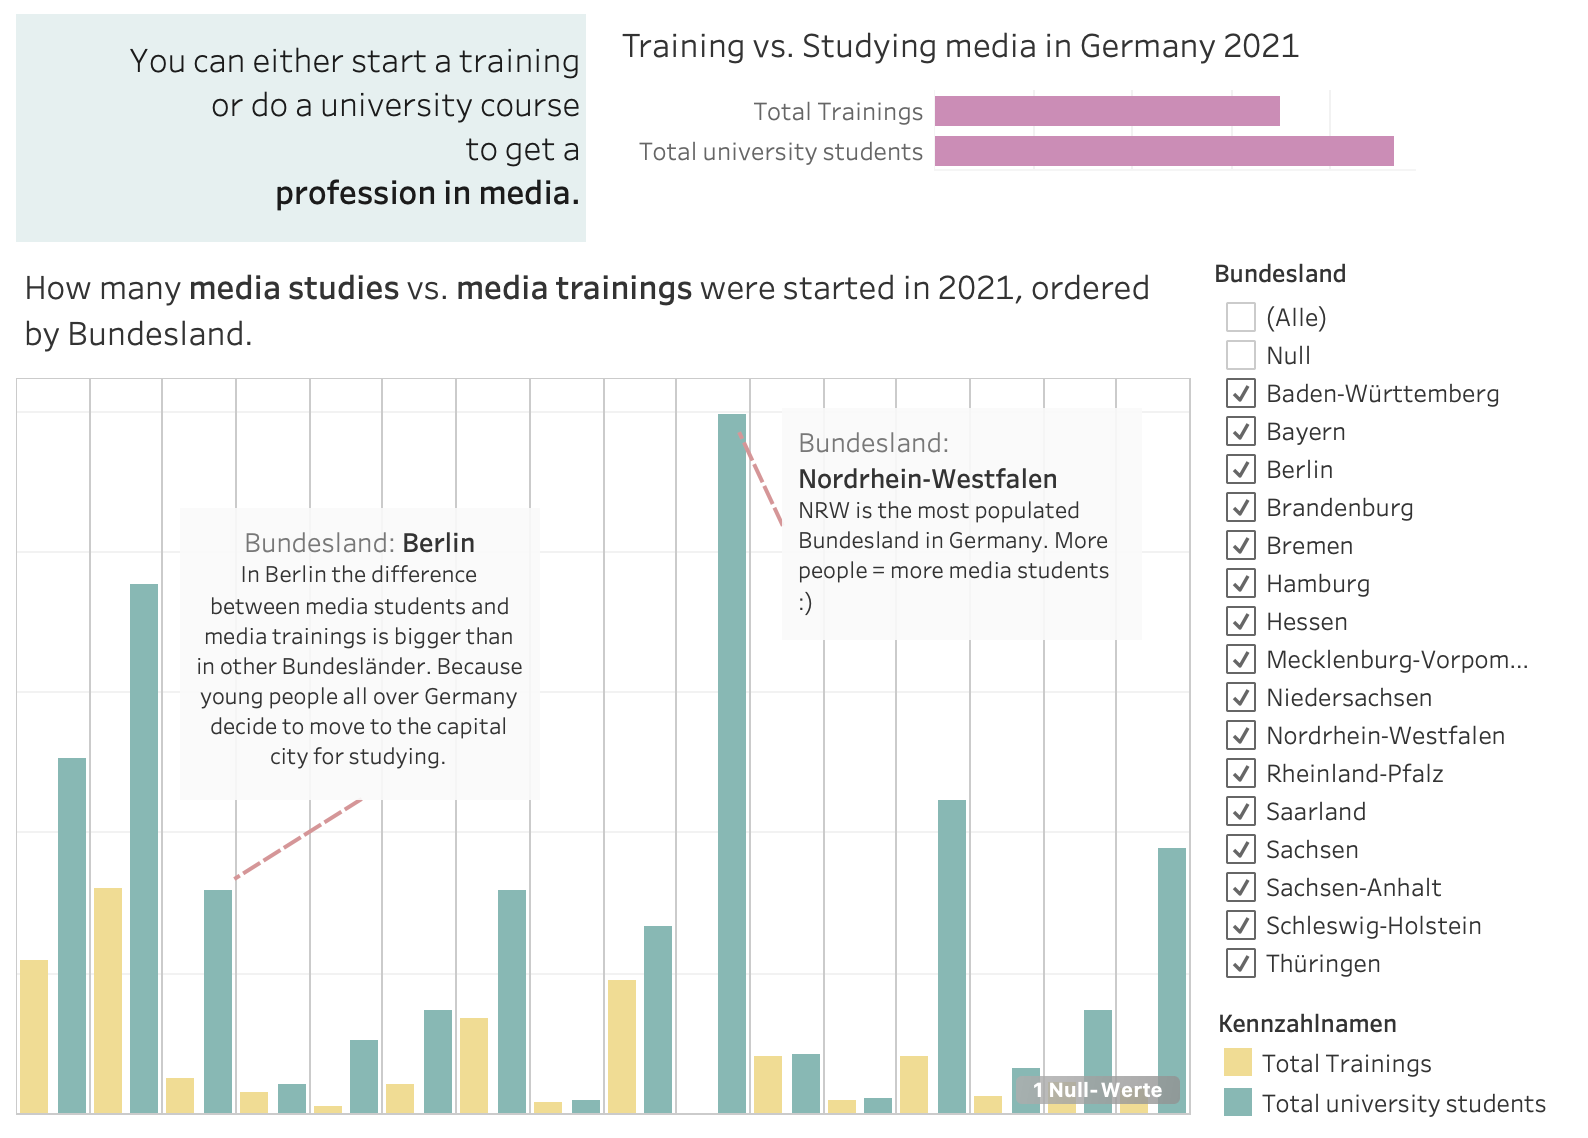
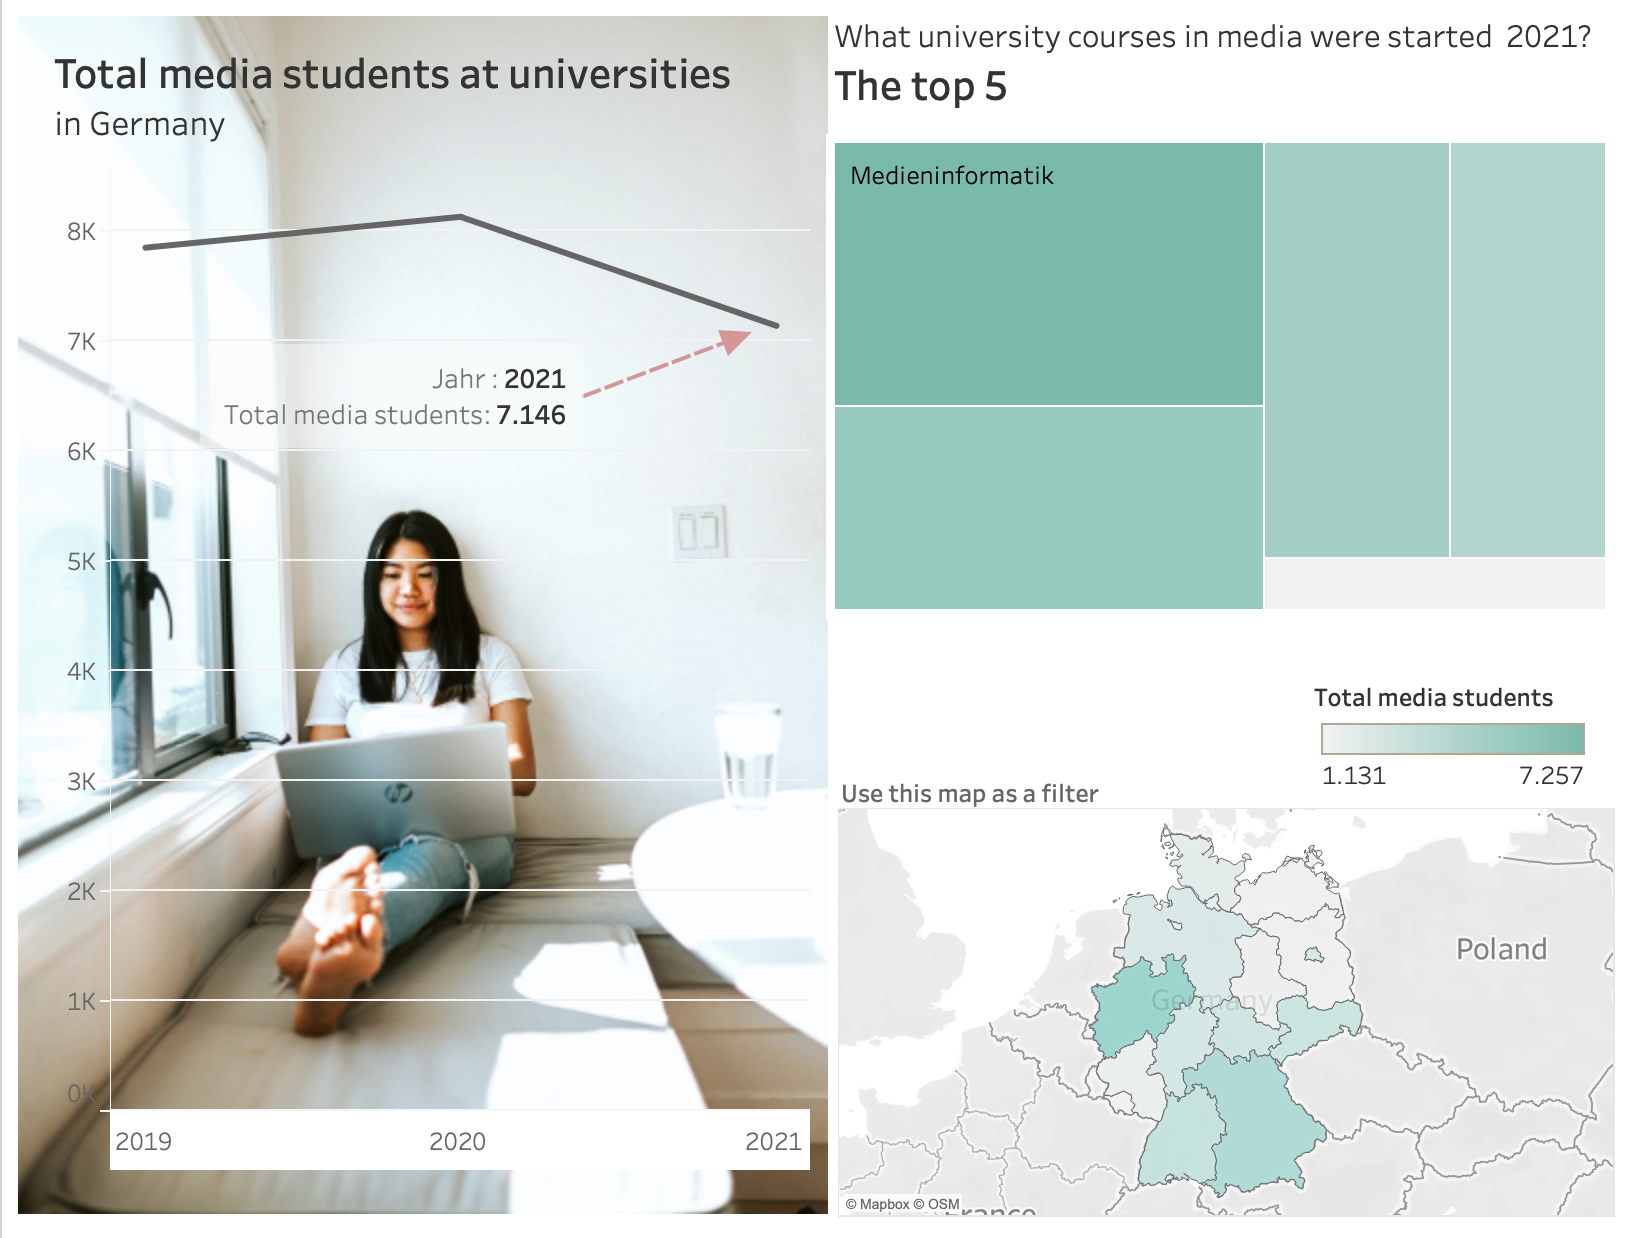
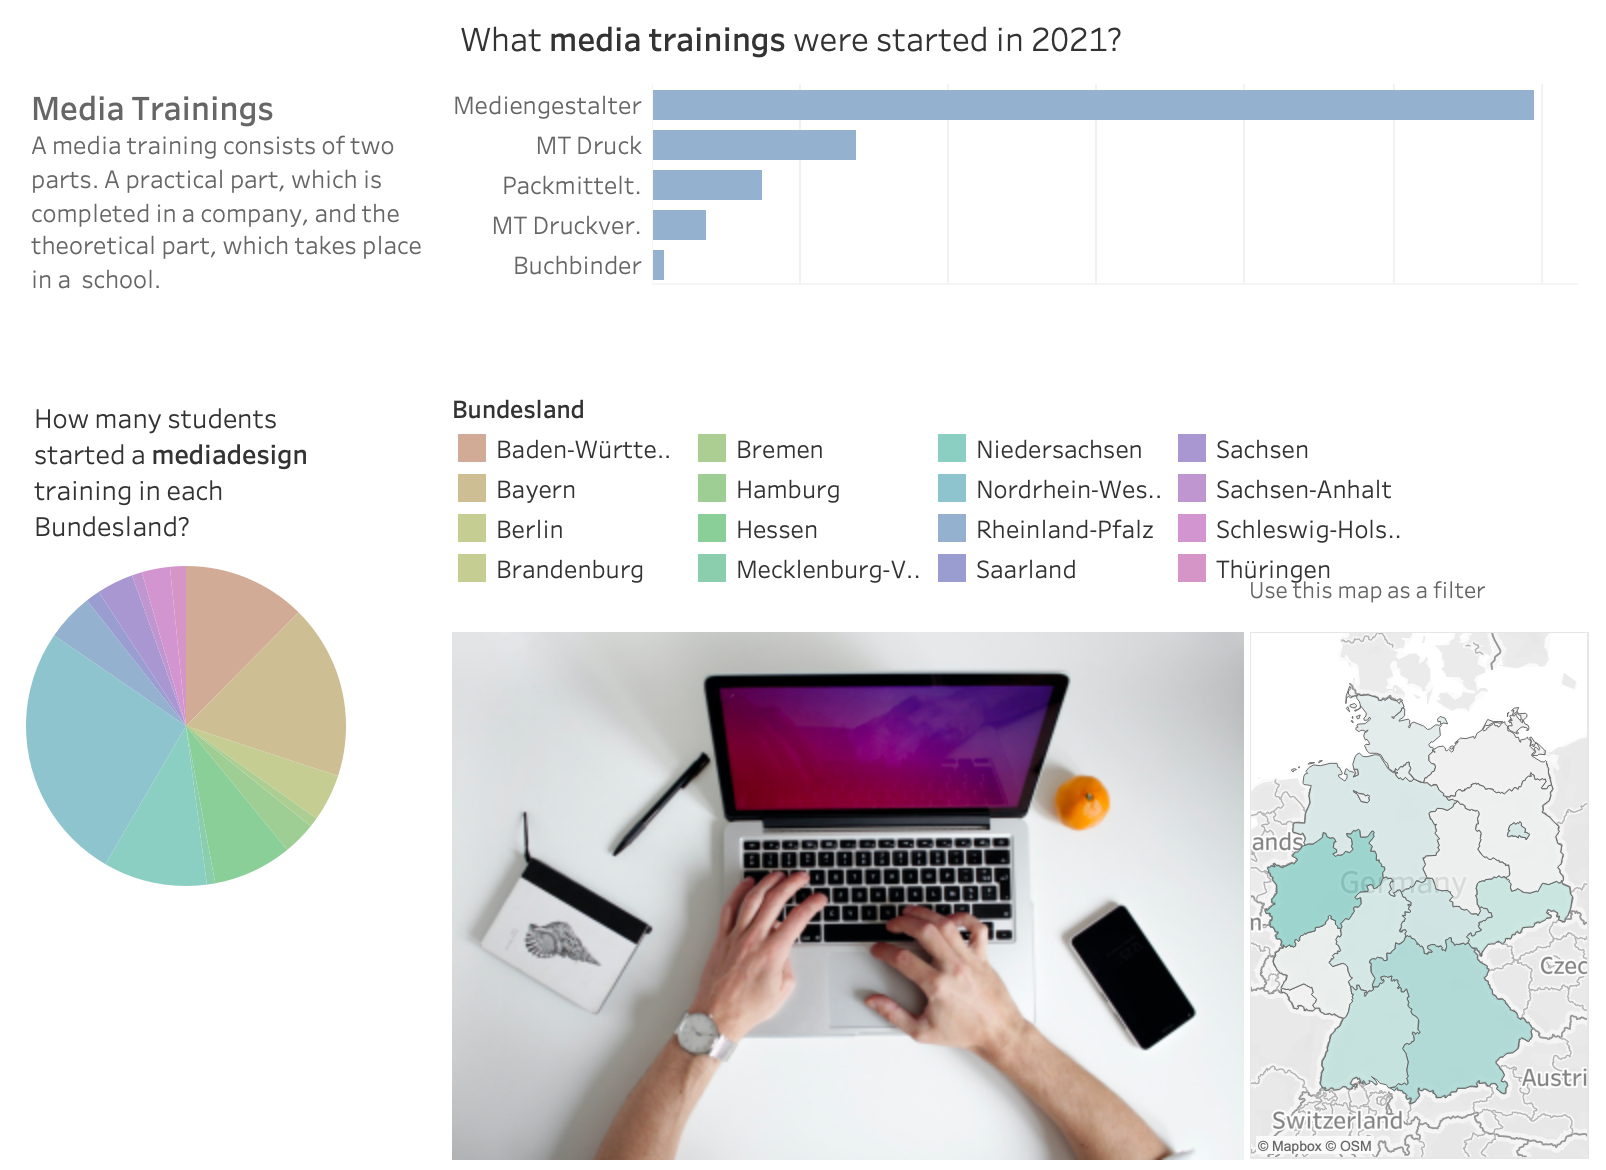
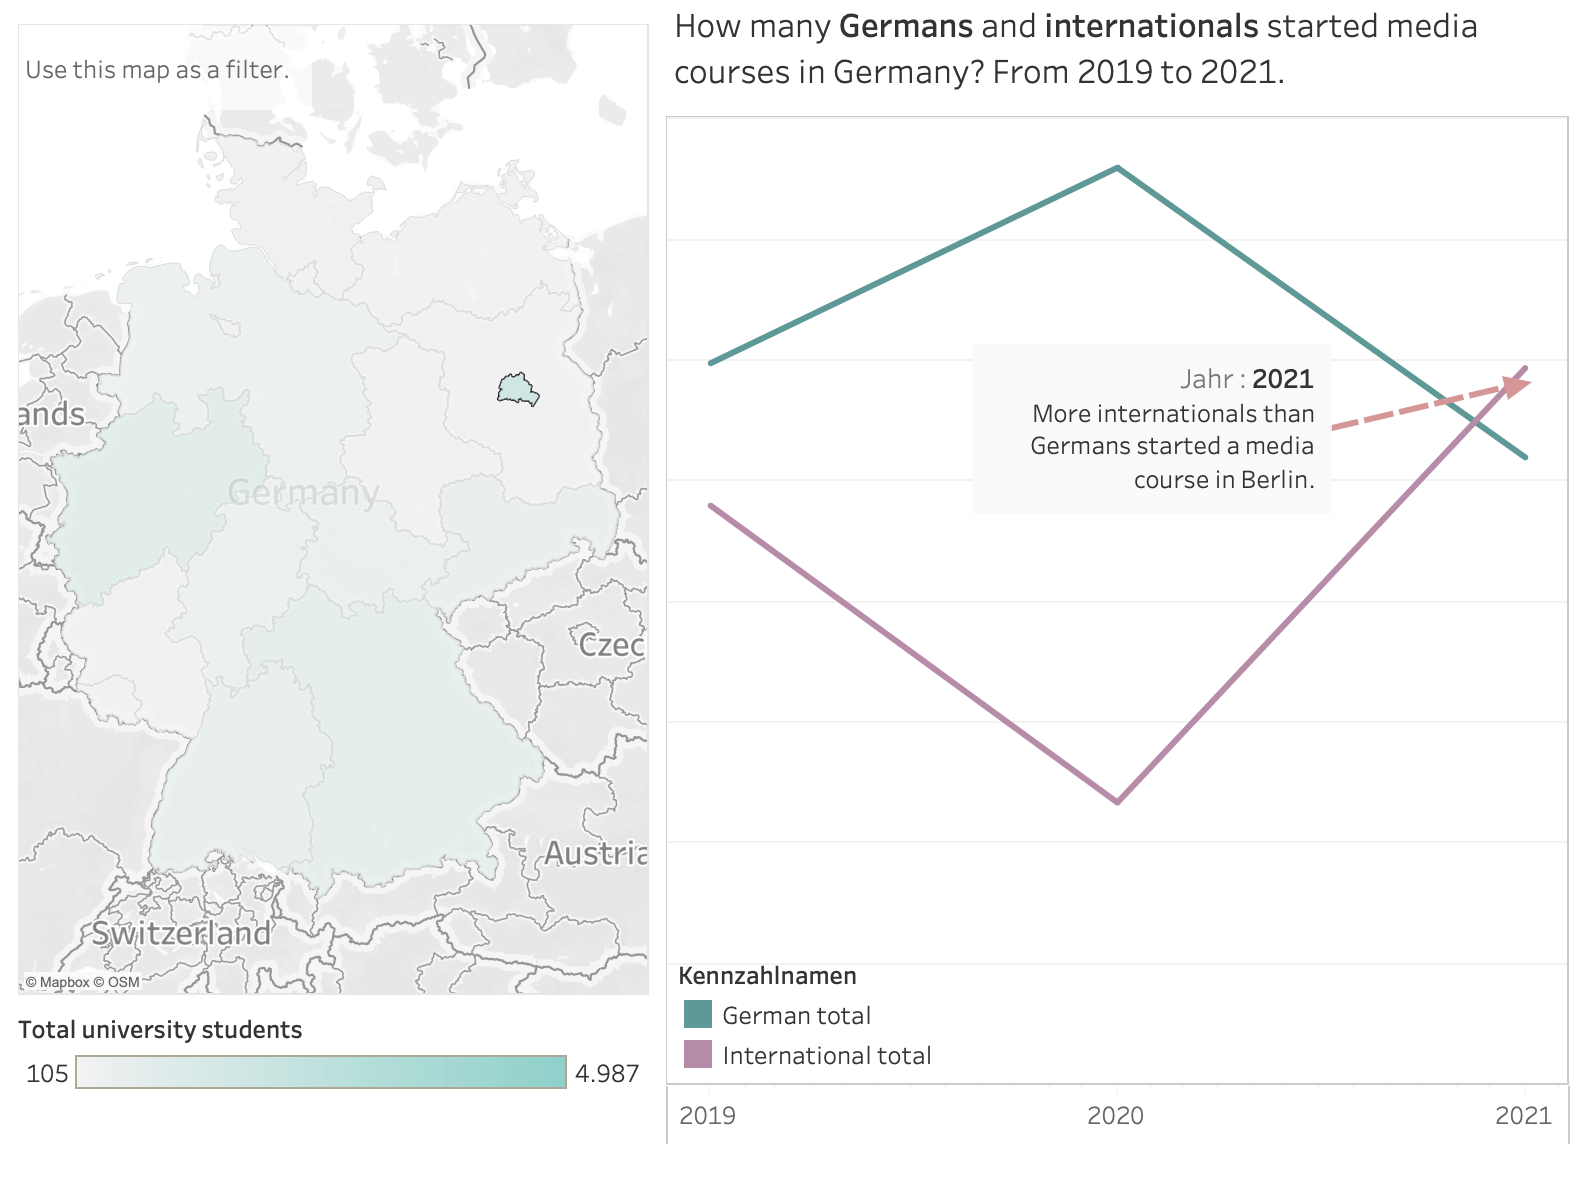
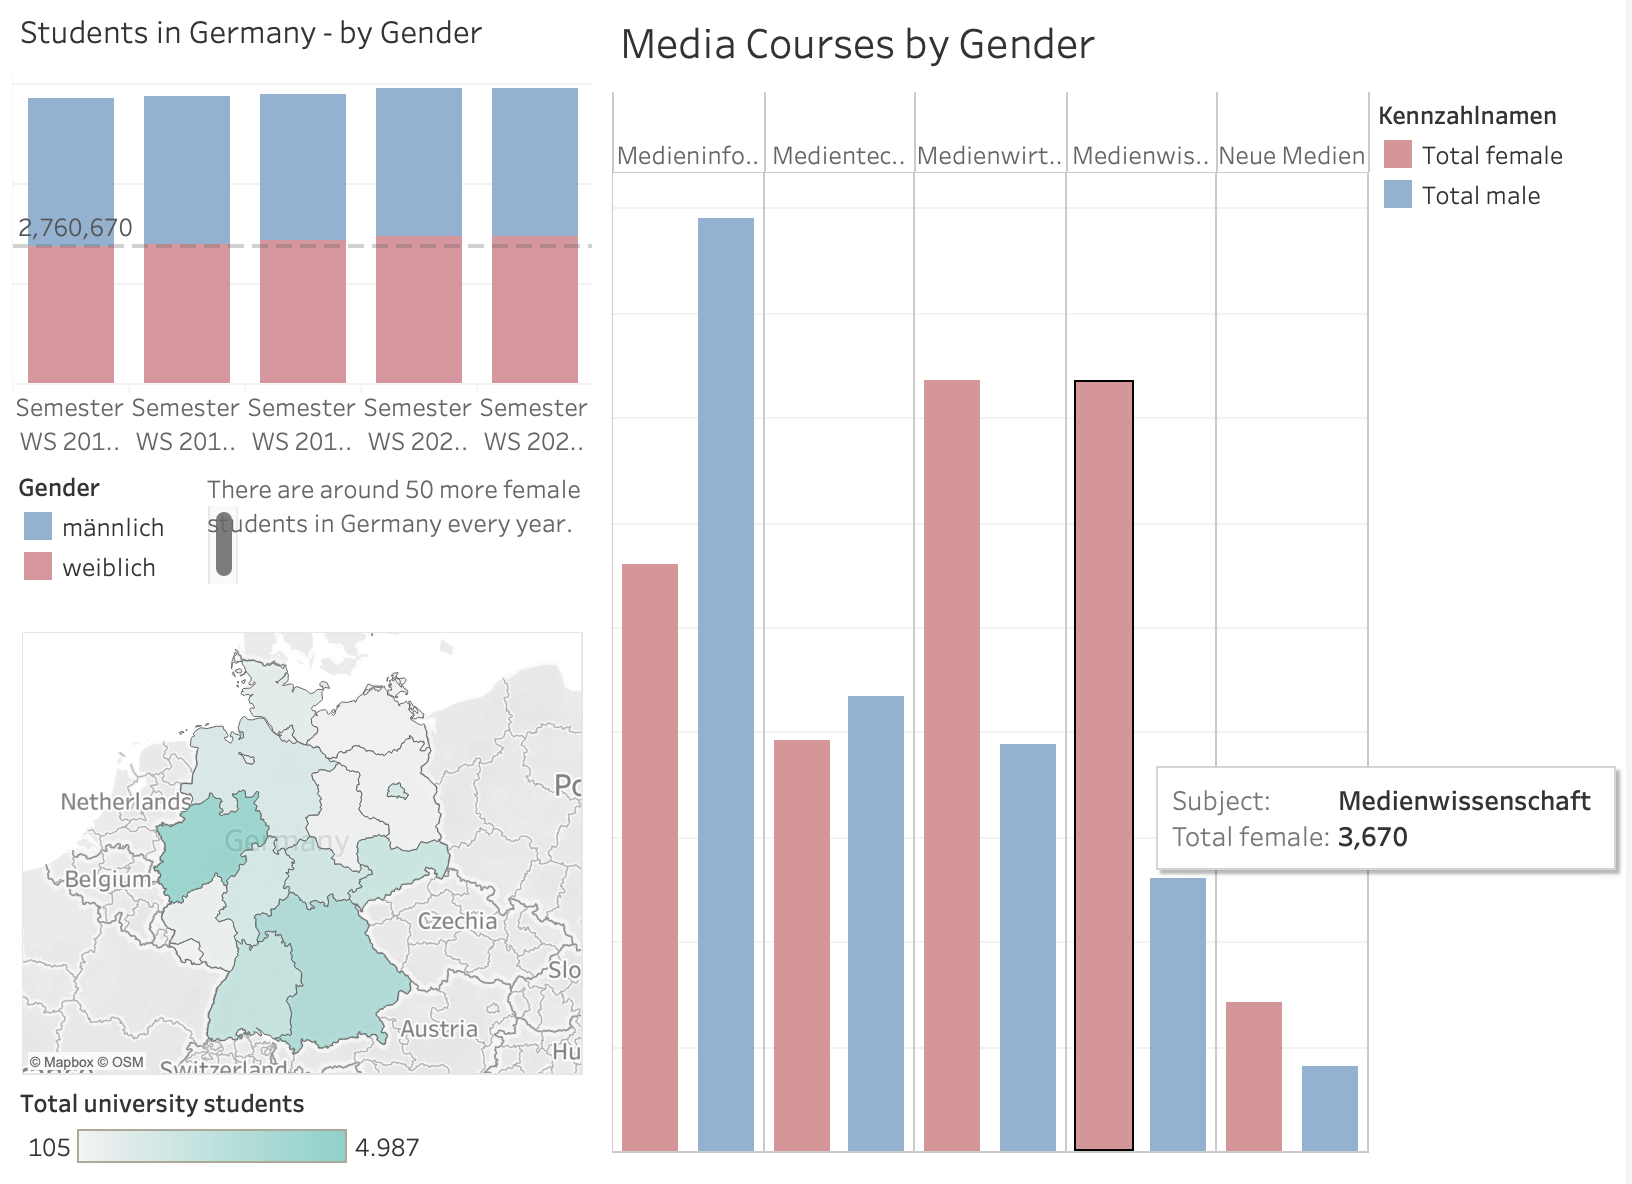
For the final project I decided to use media students data and compare it with media trainings.
- Research of data sets
- Cleaning and connecting different data sets
- Creating a style for the graphs